Example 4.1.
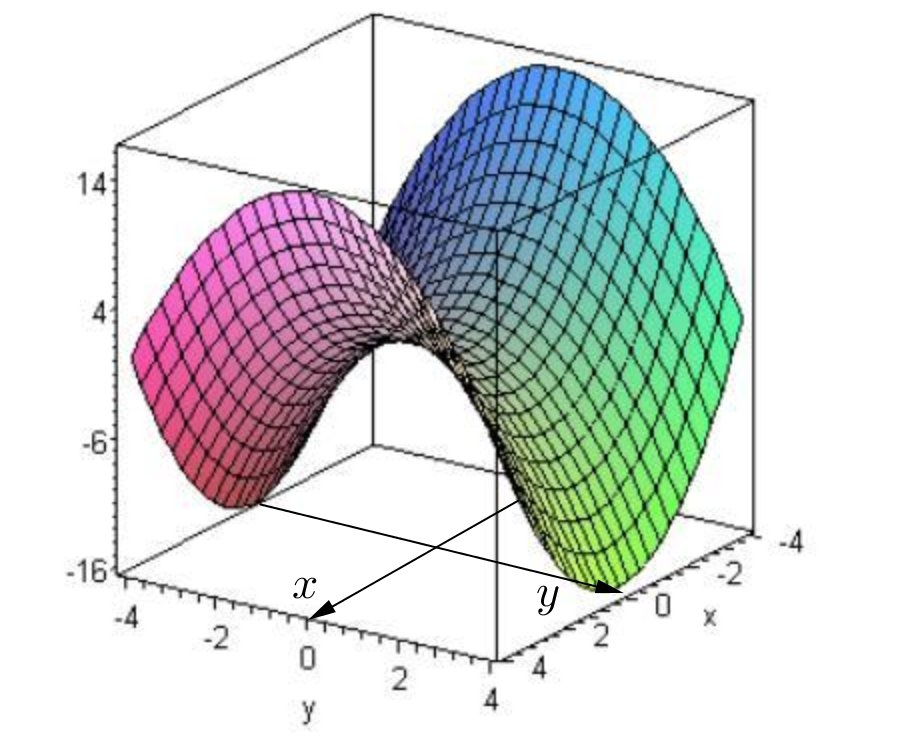
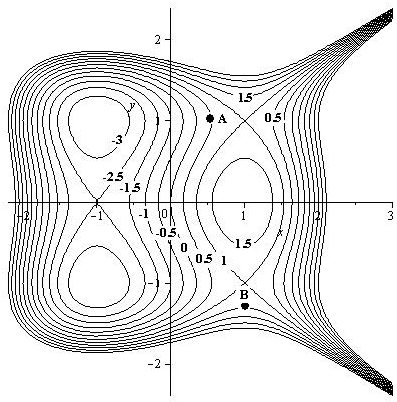
Consider the function \(f(x,y) = x^2-y^2\text{.}\) The graph of this function is shown below. At \((x,y)=(0,0)\text{,}\) \(f=0\text{.}\) As we can see by looking at the graph, as we move away from the origin along the positive \(x\)-axis the value of \(f\) is increasing, i.e. the rate of change of the function will be positive. However, if we move away from the origin along the positive \(y\)-axis the value of \(f\) is decreasing, i.e. the rate of change of the function will be negative.